Grafana
Grafana
This guide will walk you through how to set up Grafana, Prometheus, and UnifiedMetrics so you can have more stats about your Minecraft server(s), which couldn't be done without our lovely server splitter :) This guide is more complex than others as it's an advanced setup, but it will allow you to see tons of cool stats about your server(s).
We'll be using 3 different software that all have their purpose.
UnifiedMetrics - Plugin that's installed on your Minecraft server that gathers the data and constantly publishes it in a Prometheus readable format. Prometheus - The database that stores all your fancy data and reads UnifiedMetrics. Grafana - A beautiful open source tool that allows you to interact and explore with all your data.
If you want to connect multiple servers to your Grafana dashboard you can do so by adding multiple jobs to the Prometheus server. See explanation under Multiple servers.
UnifiedMetrics
Download the plugin from GitHub and install it in the plugins folder.
For assistance on how to install plugins, please refer to the plugin installation page.
Now you're gonna want to open up the default port for UnifiedMetrics (9100) under the Ports & Proxies tab.
We're now done with UnifiedMetrics, onto Prometheus :)
Prometheus
Now we're going to set up a Prometheus server. You will want to split a Prometheus instance which is located under the "NO SUPPORT SERVERS" category with 150MB of RAM and 10GB of Storage (may need to be adjusted to your needs). For assistance on how the server splitter works, please refer to the server splitter page.
Once the server is created, head to it under the Server Split tab.
Now we're going to edit prometheus.yml and add UnifiedMetrics in the Prometheus server.
To do this, we're simply going to change localhost:9090 to your server's IP address and UnifiedMetrics port (9100), then start up prometheus.
Grafana
Now you can use Grafana Cloud, or a self hosted instance of Grafana but in this guide we're gonna use a self hosted Grafana instance using Bloom's server splitter :)
Time to split a Grafana instance using the server splitter with 150MB of RAM and 1GB of storage (may need to be adjusted to your needs).
Once the server is created, change it to the default Grafana port (3000) under the Server Split tab.
At this point you may want to set up a reverse proxy for Grafana so it gets HTTPS and so users don't need to specify a port.
Simply follow this guide here.
Now, head to your Grafana's IP & Port (or subdomain if you set up the reverse proxy) and log in.
Default credentials User - admin Password - admin
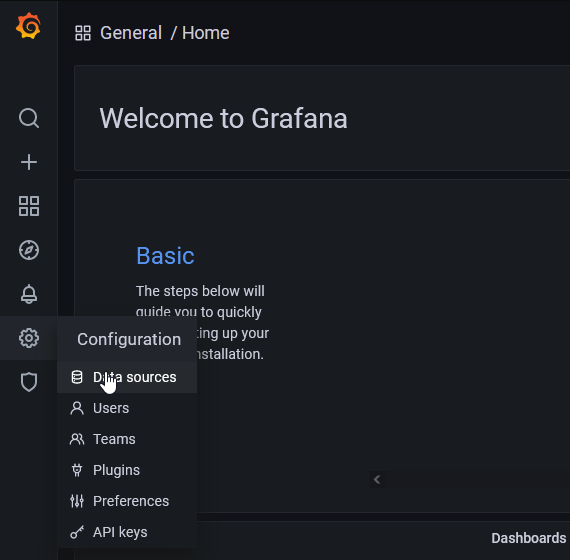
Once logged in, hover over the settings icon on the left and head to Data Sources.
Now we're going to add a new Prometheus data source, the only thing you need to modify is the URL which will be http://<SERVERIP>:<PORT> (with the port being the port of your Prometheus server).
Now, Grafana has access to all the data, but where can you view all the fancy graphs?
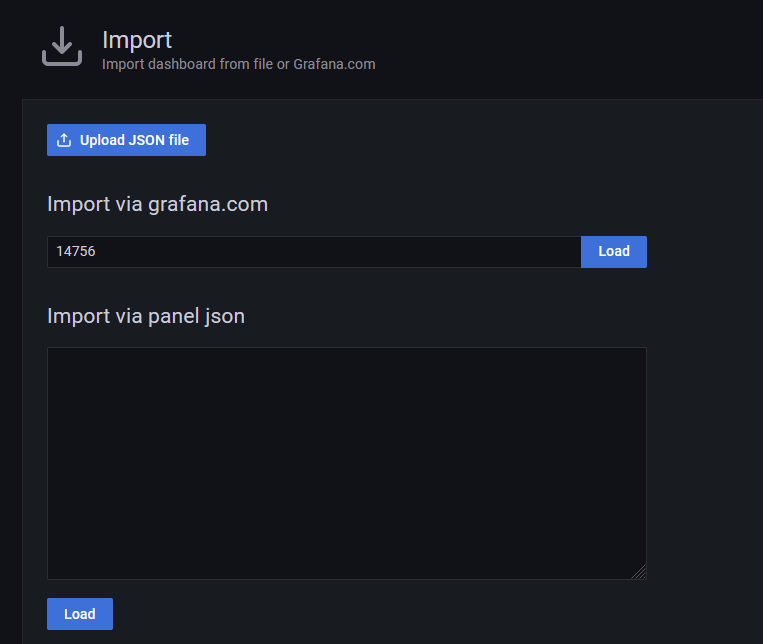
Time to add a Dashboard made by the UnifiedMetrics team. Simply hover over the + on Grafana's main page and click import. Then enter 14756 as the ID and click load.
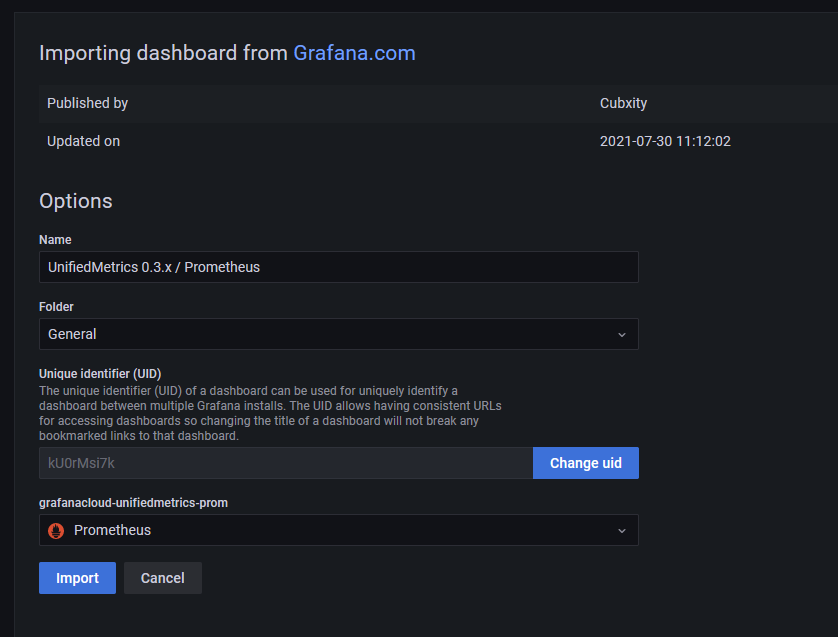
Then select your Prometheus data source and click Import.
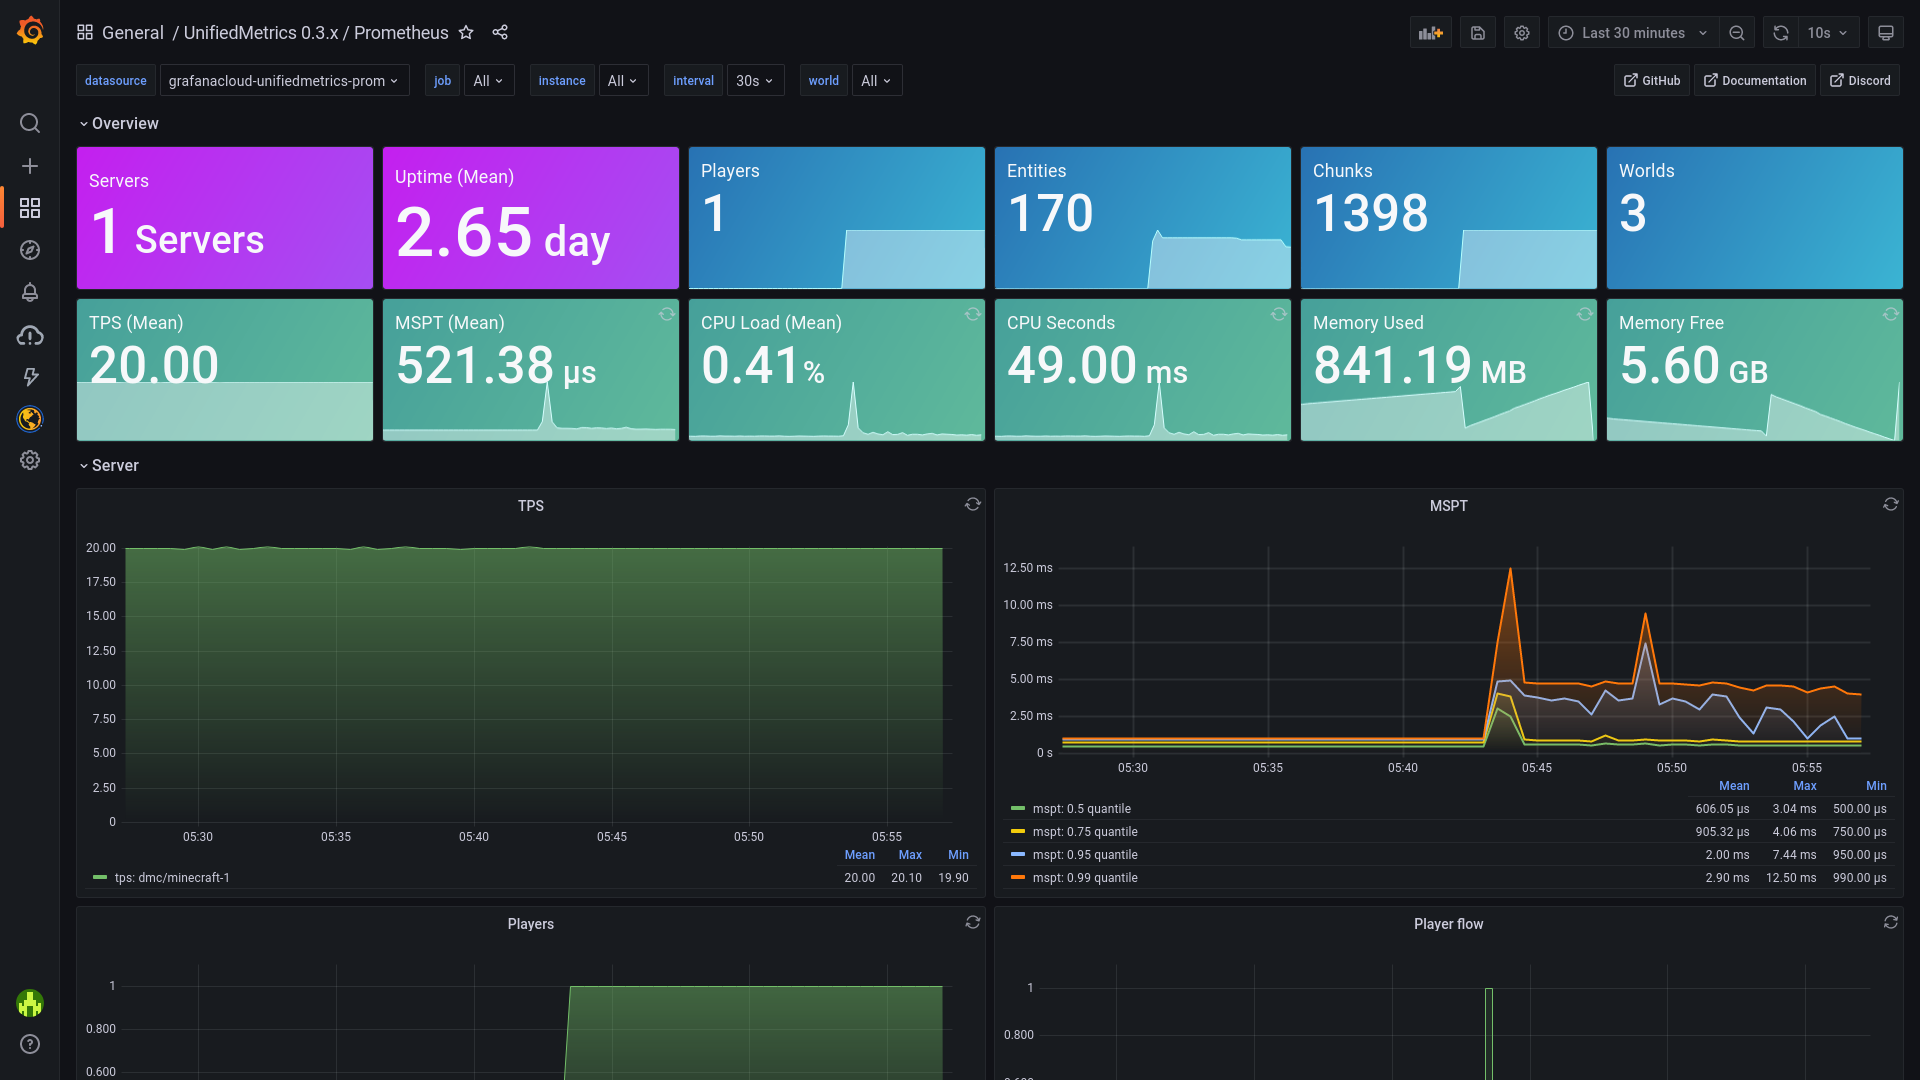
And there you have it, now you can have a ton of fancy statistics for your Minecraft Server :)
Multiple servers
You can add multiple servers to your Grafana dashboard and to get this done is quite easy. If you have followed the guide above, we can assume you have everything working.
First we gotta install UnifiedMetrics on all other servers. Download the plugin from GitHub and install it in the plugins folder. Restart your server.
After installing the plugin, you open up a port on the server. For example, 9101, 9102, etc.
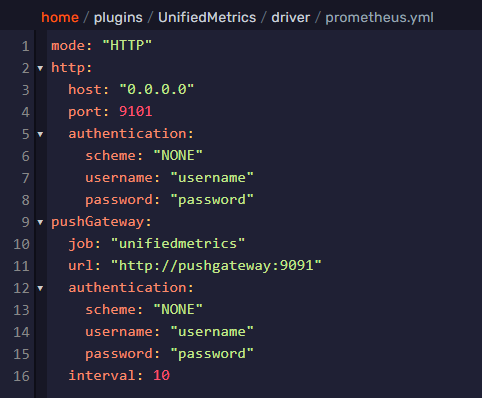
Then you change the port in the plugins/UnifiedMetrics/diver/prometheus.yml file and restart your server.
After installing UnifiedMetrics for all your servers and configuring the plugin, it is time to add the server to the Prometheus server.
You do this by editing the prometheus.yml file on the Prometheus server.
Open the prometheus.yml file and add an extra job under scrape_configs.
- job_name: "server_name" #set your server name

    # metrics_path defaults to '/metrics'
    # scheme defaults to 'http'.

    static_configs:
      - targets: ["yourip:port"] #set your server ip and port
After adding your servers the prometheus.yml file, it then looks like this.
# my global config
global:
  scrape_interval: 15s # Set the scrape interval to every 15 seconds. Default is every 1 minute.
  evaluation_interval: 15s # Evaluate rules every 15 seconds. The default is every 1 minute.
  # scrape_timeout is set to the global default (10s).

# Alertmanager configuration
alerting:
  alertmanagers:
    - static_configs:
        - targets:
          # - alertmanager:9093

# Load rules once and periodically evaluate them according to the global 'evaluation_interval'.
rule_files:
  # - "first_rules.yml"
  # - "second_rules.yml"

# A scrape configuration containing exactly one endpoint to scrape:
# Here it's Prometheus itself.
scrape_configs:
  # The job name is added as a label `job=<job_name>` to any timeseries scraped from this config.
  - job_name: "proxy"

    # metrics_path defaults to '/metrics'
    # scheme defaults to 'http'.

    static_configs:
      - targets: ["ip:9100"]

  - job_name: "hub"

    # metrics_path defaults to '/metrics'
    # scheme defaults to 'http'.

    static_configs:
      - targets: ["ip:9101"]

  - job_name: "event"

    # metrics_path defaults to '/metrics'
    # scheme defaults to 'http'.

    static_configs:
      - targets: ["ip:9102"]

  - job_name: "survival"

    # metrics_path defaults to '/metrics'
    # scheme defaults to 'http'.

    static_configs:
      - targets: ["ip:9104"]
Restart the Prometheus server and you will see the servers in your Grafana dashboard! Happy analyzing ;)