Datapacks
Datapacks
Datapacks are specially structured folders or ZIP archives that you can use to customize your Minecraft experience without using third party mods.
Installing a datapack is quite simple. Once you’ve downloaded the datapack you want to head over to your server management tab.
Open your server in the DuckPanel and open the 'File Manager' tab.
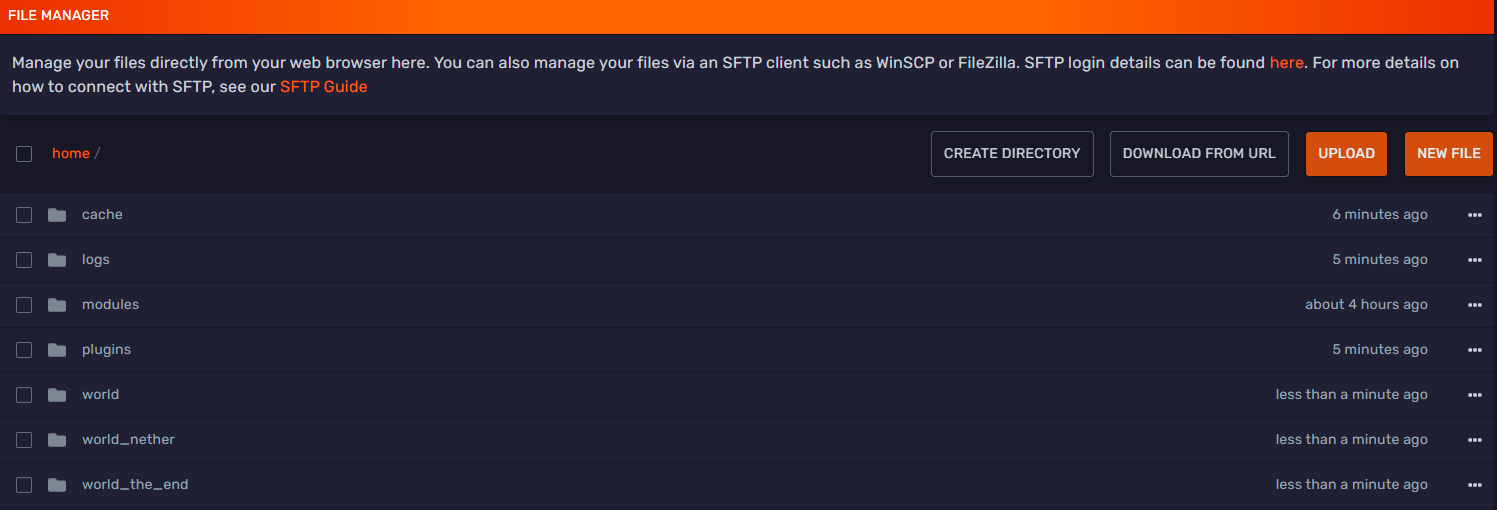
Select the world you want to install the datapack onto.
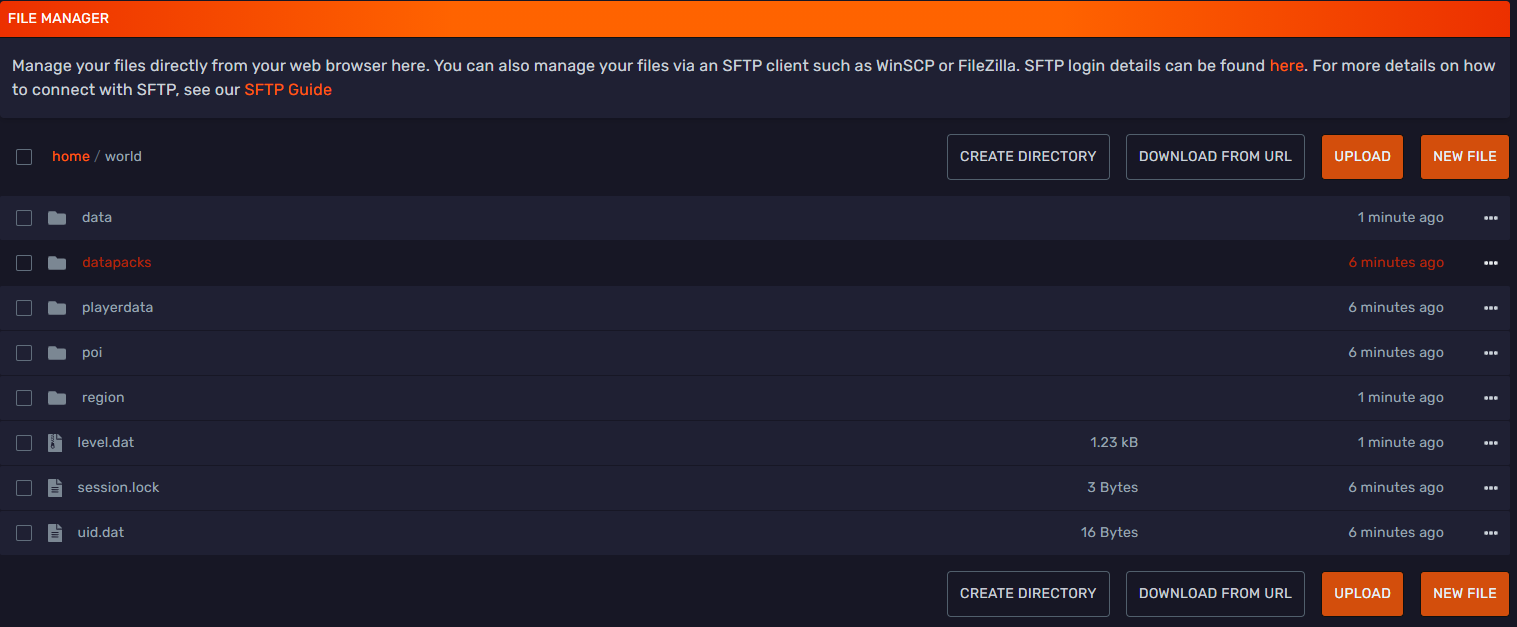
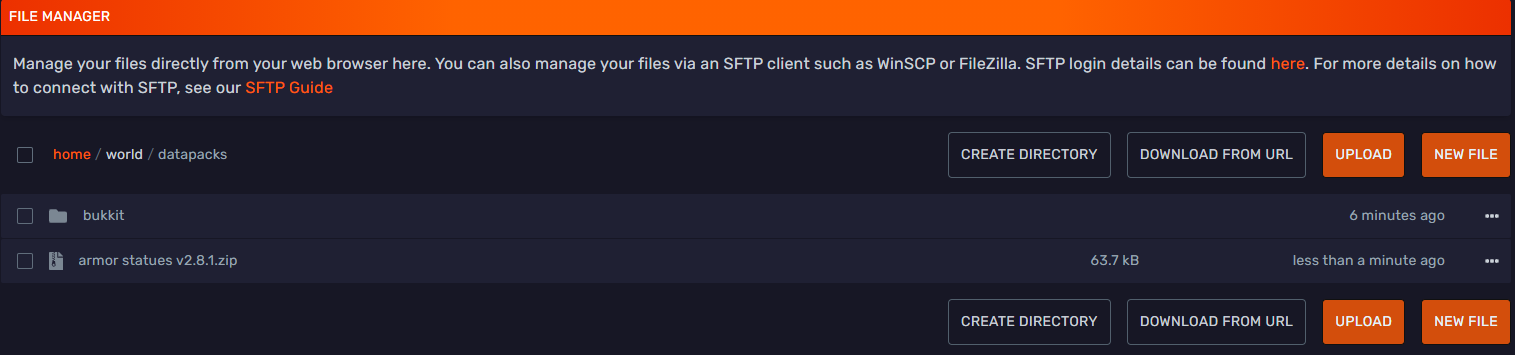
Open the datapacks/ folder and click the 'Upload' button in the top right corner.
Select your datapack to upload it. You can also drag and drop the datapack .zip file.
Remember that you need to upload the .zip datapack file, you don't need to unzip it.
Now restart your server, feel free to open a ticket if you need any assistance.
You can verify if the datapack was correctly installed by using the command /datapack list enabled.
Performance Issues
While datapacks are built into the game, they can still have a large impact on server performance.
Certain creators such as VanillaTweaks are mindful of this, but it's important to note that this is not always the case.
If you notice lag spikes or tick loss, make sure to run a Spark report.
If you find CustomFunction calls taking up a large chunk of the total server tick, it's possible one of the datapacks
is running calculation expensive commands.
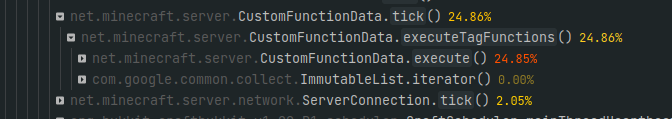
To further debug which datapack(s) or command(s) are causing the issue, you can use the game's built in /perf start profiler command.
This command is removed altogether in PurpurMC. You might have to temporarily switch to PaperMC while doing this.
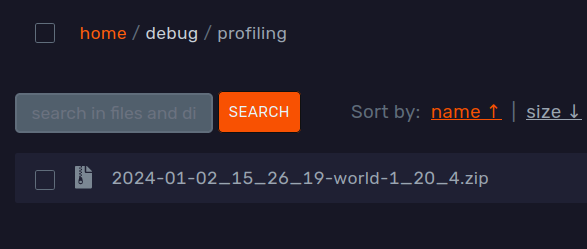
After 10 seconds, it will generate a ZIP archive which you can find in the debug/profiling/ folder:
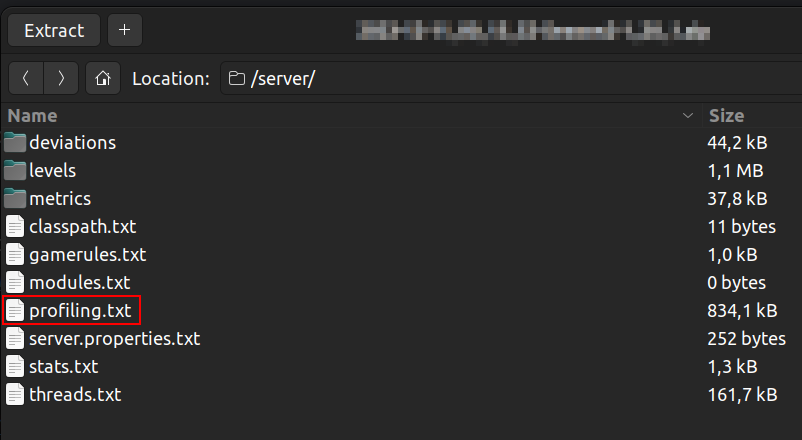
Unarchive this file, and you can find the profiling.txt in the server/ directory.
If you are lucky, the game also created a deviations/ticktime/ folder with similar contents from the specific TPS drops.
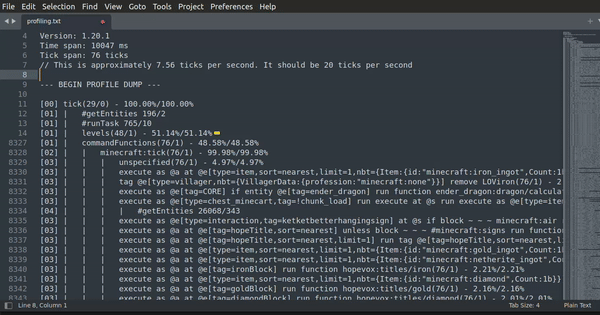
The easiest way to read this file is using Misode's report inspector tool or a modern text editor, for example Sublime Text or Notepad++.
Using any of these and find & replacing the following regular expression will allow the text editor to fold each section: ^\[.*?\]|\|
Here is an example with Sublime Text:
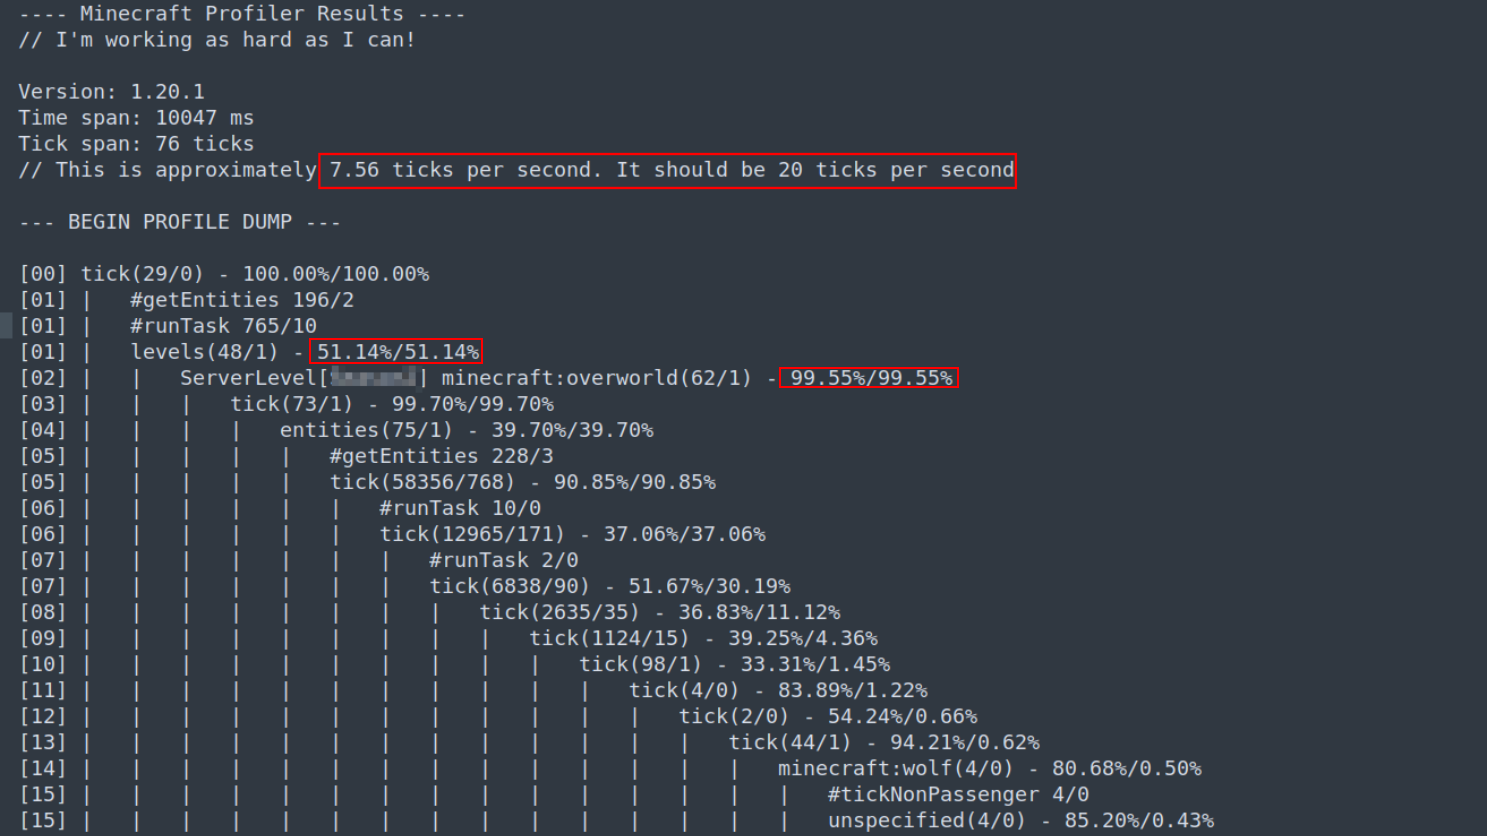
At the top of the file, you can verify that the server was experiencing tick loss while the profiler was running. If this is not the case, rerun the profiler until you can catch the issue.
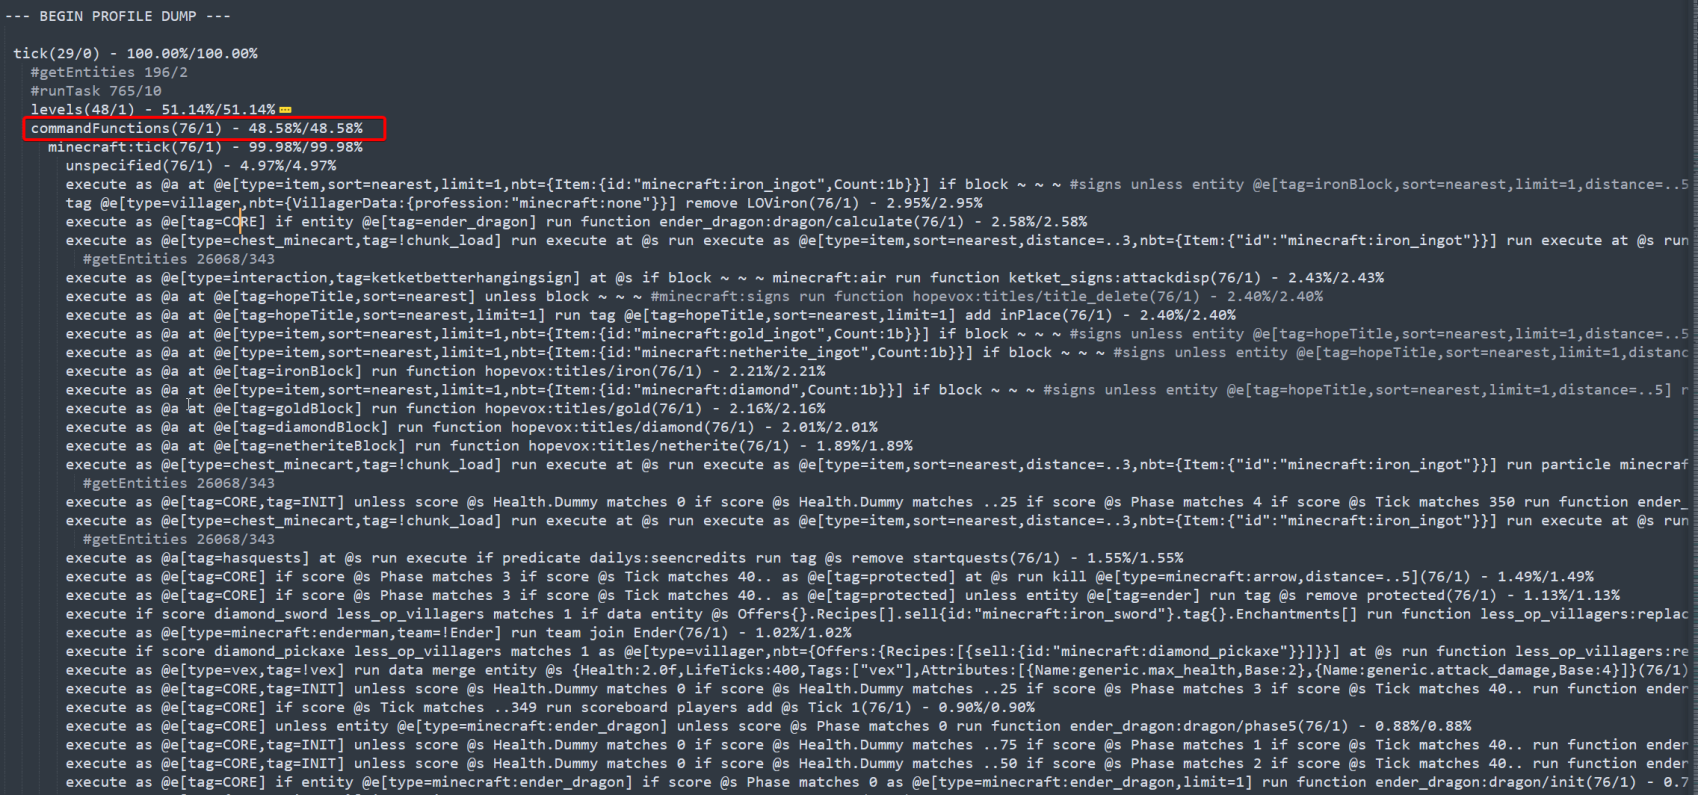
You can see how much of the total tick time certain actions take by the %-s next to the call. For example, in this case, the overworld takes up 99.55% of the 51.14%, so about ~50% of the total tick time.
When talking about datapacks, it's crucial to note that most calls at the top of the profiling are usually not the root cause, but are functions the game uses when processing commonly used commands.
Scrolling further down, you can find commandFunctions and each command that takes up any significant amount of processing time.
As mentioned above, these commands are often responsible for more processing that you can see above, such as getEntities calls.
This is especially true for commands that run selectors without any filtering, such as @e and nested
calls, for example: execute as @e at @s run <some command> @e
These are the raw commands, so if you want to find which datapack is executing them, you can simply do an in-folder search. This can be done in the DuckPanel by opening the datapacks folder under the 'File Manager' tab and searching for the command in the search bar.
Happy crafting!